NASA's Pacific storm images reveal two very different cyclone systems
What November 3 NASA Earth Observatory observations show about annular typhoons, ex-typhoon Champi and the Pacific's unusual storm activity.
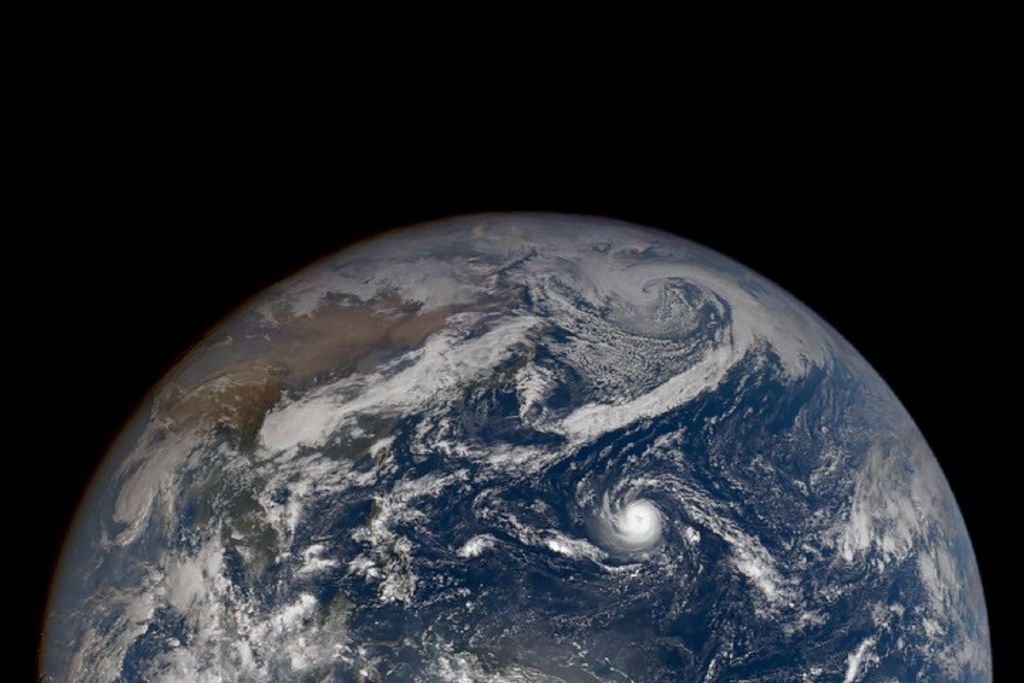
NASA Earth Observatory's November 3 report uses satellite observations from late October to compare two striking Pacific storm systems: Super Typhoon In-fa near the Mariana Islands and the remnants of Typhoon Champi moving toward Alaska. They appeared in the same broad regional picture, yet their energy sources, structures, and likely effects were not the same. The new report is an analysis of observed storms, not a live weather warning for November 3.
The image that frames the report was captured on October 29 by the Earth Polychromatic Imaging Camera, or EPIC, aboard the DSCOVR spacecraft. DSCOVR looks back toward Earth from far beyond low-Earth orbit, giving its camera a broad perspective that can put weather systems in geographic context. The image showed In-fa closer to the western Pacific islands while another expansive system associated with Champi's remnants approached Alaskan waters.
NASA also examined a more detailed October 30 view of In-fa from the MODIS instrument on the Terra satellite. At that point the storm had an unusually circular appearance and a large, well-defined eye. Meteorologists describe some storms with this kind of structure as annular tropical cyclones. The distinctive shape can be useful for identifying the storm type, but appearance alone does not establish what a particular community experienced on the ground.
NASA cites a published analysis estimating that annular storms account for about four percent of tropical cyclones in the western North Pacific. That estimate describes the sample and method used in the underlying study, not an absolute rule for every season. Such storms can have fewer prominent outer rainbands than more familiar spiral-shaped systems, and some studies associate their structure with a tendency to remain strong for longer despite unfavorable conditions.
Champi's remnants illustrate a different process. During its earlier life Champi was a tropical cyclone powered by heat and moisture over warm ocean water. As it traveled north into a different atmospheric environment, the system underwent extratropical transition. A midlatitude cyclone typically draws much of its energy from contrasts between air masses and may develop weather fronts and a broad, curved cloud shield. That change is more than a new label for an old storm.
One major practical difference is the distribution of strong winds. NASA's report explains that an ex-tropical system can spread its wind field over a larger area even when its peak winds do not grow stronger. The remnants of Champi became involved with a larger Bering Sea storm system. Researchers therefore examined how the leftover circulation may have helped strengthen the overall weather pattern rather than treating it as a single unchanged typhoon crossing the Pacific.
The report distinguishes the damage risk as well. Champi had brought severe weather to locations across the western Pacific during its earlier track, while some Alaskan communities later experienced heavy precipitation and high winds. Those effects should not be confused with a claim that all of Alaska suffered a catastrophic event. The observations describe a moving, evolving weather system with local impacts that vary substantially by place.
NASA cites Alaska climate researchers who counted Champi among several former typhoons reaching Alaskan waters during 2026. The agency also discusses El Niño as a possible influence on broader Pacific storm patterns. That is a plausible climate connection, not a demonstration that one ocean pattern caused every individual storm. Testing a seasonal explanation takes more than comparing one week's satellite images.
For readers, the larger story is about measurement and interpretation. A wide satellite view helps explain where storms are relative to one another, and closer imagery helps reveal an individual cyclone's shape. Meteorologists then combine imagery with pressure, wind, and atmospheric data to characterize the storm's development. Two systems can appear side by side in a satellite view while following very different physical processes.
The November 3 publication offers a dated explanation of late-October conditions, not a guarantee about today's forecasts. Anyone making a weather-related decision should use current warnings from the National Weather Service or the relevant regional authority. For the scientific record, NASA's original page documents the instruments, image dates, and supporting research. The central lesson is that storm classification and the timing of a satellite image both matter when interpreting a dramatic picture.
Source, method and limitations
This is original QuantaPhi explanatory writing based on a November 3 NASA Earth Observatory article. We distinguish observations from explanations and potential climate connections. It does not constitute a real-time weather forecast.
NASA Earth Observatory — The Pacific’s Busy Storm Season (November 3, 2026)